Procurement Data as a Leading Indicator of Construction Delay
Early procurement signals predict construction delays weeks before schedules show trouble.
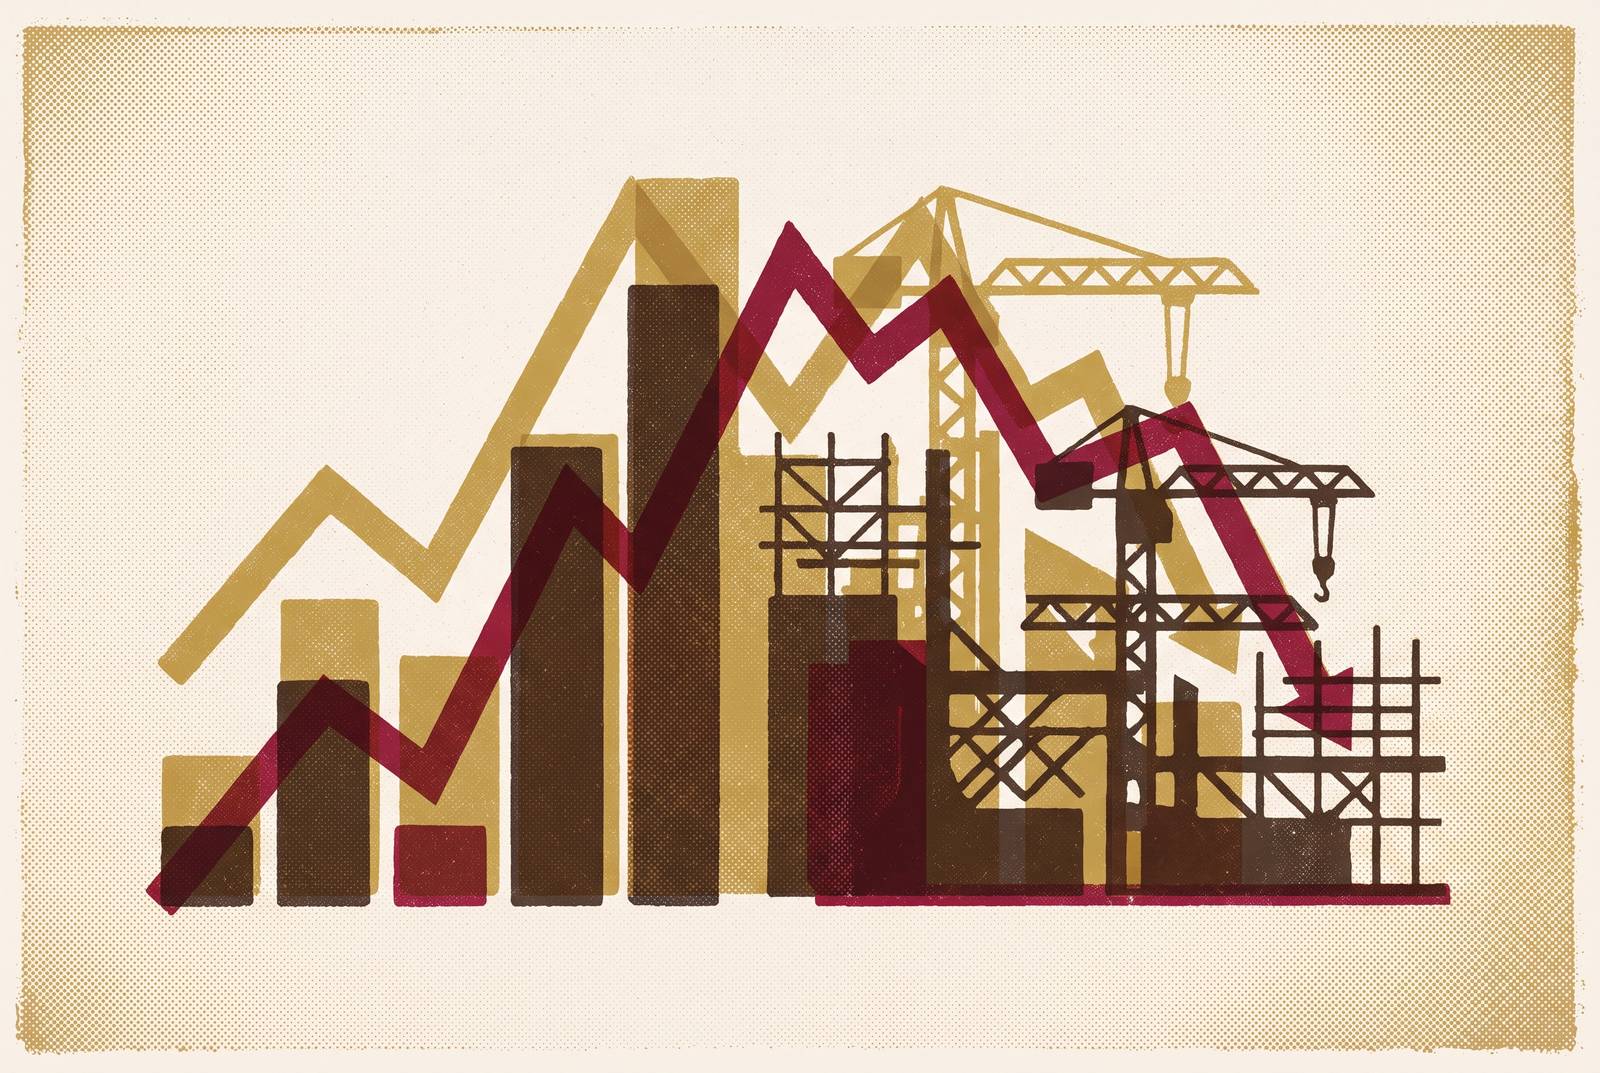
Construction delay is caused in procurement and only discovered on site. That ordering reverses where practitioners look when a schedule starts slipping. Research cited by TRC Companies found that the overwhelming majority of utility construction delay causes appear during the construction phase, but most of those causes were seeded earlier, in design and procurement decisions that could have been caught before a crew ever mobilized. The delay becomes visible on site because that is where the consequences of an unmade decision finally collide with a work sequence that assumed the decision had been made. A missing purchase order, an unconfirmed delivery date, a permit still sitting in a queue: none of these announce themselves as construction problems until a crew shows up to install equipment that has not arrived. Eid et al. (2026), writing in Scientific Reports, validated the most critical delay factors across 141 real projects and found that owner-related factors, which include procurement decisions, change orders, and design modifications, account for roughly half of the most critical delay drivers, with contractor execution failures ranking below them. The World Bank's study of infrastructure procurement delays confirms the same sequence in public-sector capital projects: delays in the procurement cycle propagate predictably into contract execution delays, and the two phases do not separate cleanly in practice. The practical conclusion follows directly from that evidence: a schedule slips on site because a commitment did not get made upstream, and the site is simply where that absence finally costs time.
How near-universal delay makes individual project explanations insufficient
The sheer frequency of delay rules out most of the explanations teams reach for first. Treating each instance of delay as a discrete site event stops making sense once delay is the default outcome rather than the exception. Buildern's report found that the overwhelming majority of North American construction projects face delays, with average project duration extending substantially beyond original projections, a pattern consistent enough that it calls for a cause that operates across the industry rather than within any one job. A single project can plausibly point to weather, a difficult subcontractor, or an unusual site condition. An industry cannot. Archdesk's 2026 review of a large sample of CPM programmes found that nearly three-quarters finished later than the original baseline end date, and only a small fraction of those baseline schedules met high-quality standards at the point of award. A schedule built on a weak baseline was never an accurate picture of what delivery would require, so the slippage that follows is the plan's own unsoundness working itself out over the following eighteen months.
Eid et al. also note that across the global literature, the vast majority of construction projects face delays that extend durations by a significant margin, and the pattern holds across both developed and developing markets. That geographic consistency is itself evidence. If the cause were regional regulation, labor markets, or climate, the rate of delay would vary by region. It does not, or at least not enough to explain outcomes this uniform. Some projects are genuinely caught by events nobody could have planned around, and that explanation holds for a fraction of cases. It does not hold for the pattern as a whole, because a cause that produces near-universal outcomes has to be a cause that operates near-universally, and procurement decisions, made or deferred at every project regardless of geography or sector, fit that description in a way that weather does not.
The specific procurement data signatures that precede schedule failure
If procurement is the upstream cause, it should leave readable traces before a schedule shows any sign of trouble, and it does. Several procurement data points reliably move before the schedule does, and each one works for the same underlying reason: it reflects a commitment that has not yet been made, while the schedule still assumes that it has.
Purchase-order issuance dates are the clearest case. When a long-lead item has no PO issued by the point in the schedule where delivery is assumed, the delay already exists in fact, the schedule just has not registered it yet. Supplier confirmation carries the same logic one step further: the gap between a PO going out and a supplier actually confirming a delivery date is itself a signal, because an unconfirmed date sitting in a schedule is not a real commitment, it is a placeholder dressed up as a fact. Buildern has coalesced around a metric built for exactly this problem, Average Material Lead Time Variance, which tracks the deviation between expected and actual delivery time for critical materials, and many leading contractors now keep rolling three-month material forecasts, refreshed weekly, specifically to catch that variance before it reaches the critical path.
Labor productivity data carries a similar warning months before it would normally be read that way. Construction Industry Institute benchmarking data, cited by banamind.ai, found that a subcontractor running more than 15% below labor plan in month one is a strong predictor of significant delay by the project's midpoint. That is a procurement signal rather than a site-management one, because it reflects a mismatch between the resource commitments made at award and the capacity the subcontractor actually brought to the job. Permitting data works the same way in a different domain. TRC Companies document how permit delays turn into procurement failures for long-lead equipment, because when an approval stalls, the developer loses a manufacturing slot that cannot be recovered without consequences stretching years, not weeks. The permit queue date is itself a procurement exposure.
Archdesk's 2026 analysis identifies the specific cluster to track together: late materials percentage, approvals aging, and the value of pending changes. Teams that review those three figures weekly catch problems early enough to act on them, while teams that wait for month-end reporting find out only after the window to protect margin has closed. The World Bank's procurement delay study reinforces the same logic at the level of the whole procurement cycle: delays in the tender and award phase propagate directly into contract execution, and the duration of the procurement cycle itself functions as a leading indicator, with longer cycles correlating with worse delivery outcomes.
Why the schedule misses these signals until it is too late to act
None of this is a failure of scheduling software. P6 and equivalent CPM tools were never built to track the status of a purchase order, a supplier's confirmation, an approval sitting in a permitting office, or a lead-time variance report, because the inputs the plan depends on are external to the tool that is supposed to manage them. Archdesk's 2026 analysis of CPM programmes found that only a small fraction of baseline schedules meet high-quality standards at the point of award, with poor logic, poor links, and poor constraints baked in from day one. A schedule built that way was never an accurate model of delivery reality, so when procurement slips, it is revealing a weakness that was present at the start and simply had not yet been tested.
Field reporting adds a second layer of lag on top of the first. On large projects, site supervisors often report progress through informal channels, and that information does not reach the formal schedule until the next coordination cycle, by which point the distance between procurement reality and schedule assumption has grown wider still. Archdesk's research identifies the first visible symptom of this breakdown as schedule churn, an unstable critical path and work proceeding out of sequence, rather than a missed finish date itself. By the time a finish date is visibly at risk, the procurement failure that caused it happened weeks or months earlier. Teams managing strictly from the schedule are therefore managing from a lagging indicator of a lagging indicator. They are responding to the echo of a procurement problem long after the problem occurred, using a tool that was never designed to carry that information.
The transformer and long-lead equipment crisis as the sharpest current case
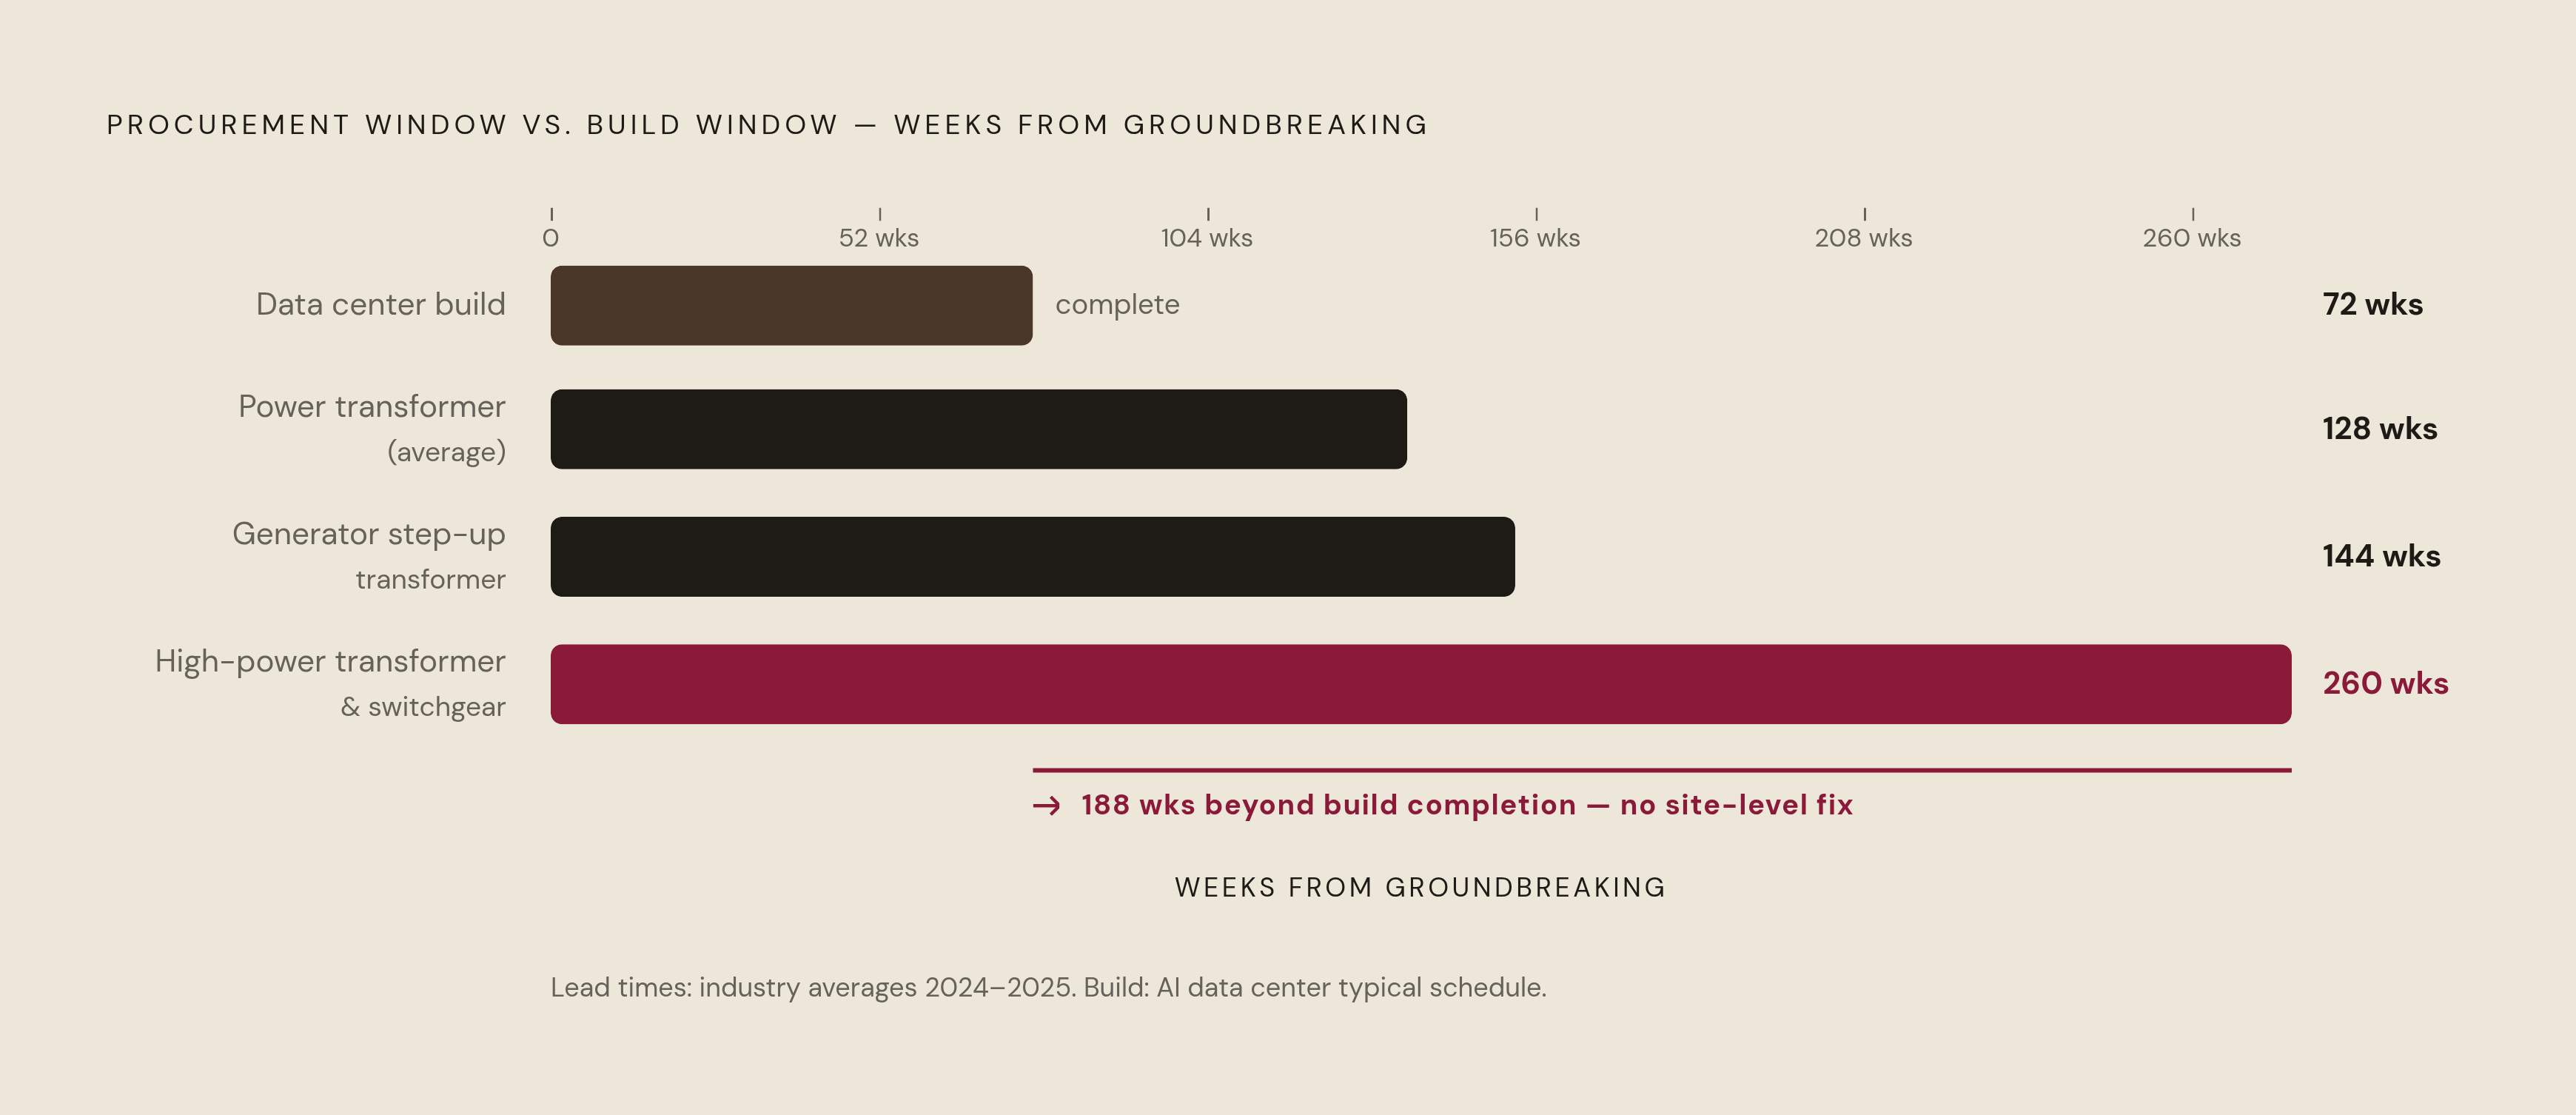
Grid infrastructure and data center construction now make the abstract argument concrete, because the procurement window for core equipment has grown longer than the construction window itself. When the time required to procure equipment exceeds the time allotted to build the project around it, no amount of site-level management can produce an on-schedule result. The order date becomes the only variable that matters, because by the time ground is broken, the equipment's delivery date is already fixed, and whether it falls inside or outside the construction window was decided months or years earlier.
TRC Companies, citing Power Magazine, report that power transformer lead times now average approximately 128 weeks, with generator step-up transformers running closer to 144 weeks. A project that waits until groundbreaking to place that order cannot receive the equipment in time to energize within a normal construction schedule, full stop, because the math simply does not close. TRC Companies, citing Wood Mackenzie, also document a surge in demand for transmission and distribution equipment since 2020, driven by data center expansion, grid modernization, and the broader energy transition, to the point that a utility ordering equipment today may not see delivery until 2028 or 2029. Bloomberg's reporting names the specific chokepoint inside that surge: high-power transformers, switchgear, and batteries, the equipment that physically connects a data center to the grid, where deliveries that used to take 24 to 30 months can now stretch to as long as five years, even as AI data centers themselves get built in under 18 months. The gap between those two numbers, a five-year procurement cycle against an 18-month construction cycle, is the clearest illustration available of what happens when procurement stops functioning as a support function and instead becomes the limiting factor on the entire project.
Contractors are already adapting to that reality. DPR Construction's Q1 2026 Market Conditions Report documents a procurement workaround in direct response to this pressure: sourcing a substantial share of material through a distributor rather than waiting on the manufacturer, because the distributor could deliver earlier on an accelerated schedule. That decision, made in procurement, determined what the project could achieve on site. The leading response among experienced teams goes further still, running two linked programmes in parallel: one tracking procurement slots and vendor dates, the other tracking site assembly, with the procurement schedule effectively promoted to master schedule and construction sequencing built around it. That is the general argument of this piece in its most visible form. The procurement commitment date determines the outcome available to the project, and the construction schedule simply documents whatever that commitment did or did not produce.
What happens when procurement signals are ignored (the financial and dispute exposure)
Ignoring these signals costs money in specific, measurable amounts, not just time in the abstract. HKA's CRUX Insight report, covering a large sample of major projects across 114 countries, found that on distressed jobs the average sum in dispute runs to a third of the total contract budget, and the average time claimed reaches nearly two-thirds of the planned project duration. Those two figures describe what it costs, at scale, to let procurement risk run unmanaged until it becomes a schedule crisis and then a legal one.
Scope change sits at the center of a large share of that exposure. Archdesk's research found scope change present in nearly three-quarters of major disputes, and the real cost does not come from the change itself but from what happens while it waits for instruction: site teams keep moving, prelims keep running, disruption compounds, and the dispute that eventually surfaces is procurement-adjacent as much as it is design-adjacent. Price volatility sharpens the same exposure further. Construction input prices rose sharply between early 2020 and early 2025, and tariffs have touched a large majority of contractors in that period. A late buyout in the current environment can erase a project's margin before the delay itself ever becomes visible on the schedule. The consequences extend past any single project's budget. A 2025 study by Resources for the Future, cited by TRC Companies, found that transmission and generation development delays raise electricity and natural gas prices for consumers, so the cost of procurement-driven delay is ultimately paid by ratepayers as well as by project owners. None of these figures describe an inevitable outcome. They describe what happens when procurement data that was readable weeks or months in advance goes unread, a choice available to change.
Procurement indicators that cross from noise into genuine schedule risk
Not every variance in procurement data signals real trouble, and treating all of it as equally urgent defeats the purpose of watching it. The indicators that cross from ordinary noise into genuine schedule risk share a specific structure: they sit on the critical path, and they represent a commitment gap that cannot close without changing the program itself.
A lead-time variance on an item with float can absorb weeks of slippage without touching the finish date, so the first filter is always critical-path dependency: does this item, this approval, this subcontractor's output feed directly into the sequence that determines when the project finishes. A permit sitting in queue past its planned approval date belongs there too, once TRC Companies' finding about lost manufacturing slots applies, because the loss in that case is not measured in days but in the multi-year consequence of missing a slot entirely. A subcontractor running more than 15% below labor plan in month one crosses into the same category, given CII's finding that this threshold predicts significant delay by the project's midpoint rather than a recoverable early-stage dip. By contrast, a single week of supplier confirmation lag on an item with substantial float, or a modest dip in productivity that recovers the following month, stays inside the range of normal variance that every project absorbs without consequence.
The distinction that matters is not the size of the number alone but whether the item sits on the path that determines the finish date and whether the gap it represents can still close without restructuring the program. Archdesk's recommended weekly review of late materials percentage, approvals aging, and the value of pending changes gives teams a working filter for that distinction, catching the cluster early enough to intervene rather than discovering it in a month-end report once the chance to protect margin has already passed. That is the operational core of treating procurement as a leading indicator: not watching every number, but watching the few numbers that, on the evidence assembled here, have already been shown to predict the outcome before the schedule does.
Sources
- Project Delays in Construction: Key Metrics for 2026
- Global Construction Delays & Cost Overruns: 2026 Insights
- Managing Delays in Utility Construction: Root Causes, Real Impacts and Proven Mitigation Strategies
- Drivers of Delays in Procurement of Infrastructure Projects
- Multistage assessment of construction delay factors using expert evaluation and real project data - PMC
- Q1 2026 Market Conditions Report
- AI Forecasting Tools for Construction Firms: 2026 Guide